


30
Oct
Filed Under: Interface Design
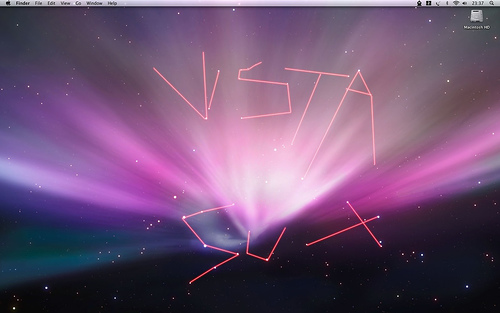
This is a demonstration of Skyrails, a new visualisation system for datasets. It struck me that this is awfully similar to the scene from Hackers where they flew through that ‘city’ of ‘databases’ with all sorts of fancy eyecandy going on, but this is actually useful in plotting data and navigating it (or so it seems, judging from the short demo). Edit; Jelmar of Typehigh pointed out it’s eerily similar to EVE Online’s ingame star chart and overall camera work. Perhaps it was an inspiration.
If you’re pleased by what you see, you might be interested in checking out some of those fancy fantasy interfaces for the silver screen over at Mark Coleran’s portfolio.