


I have been working on a few technical things over the course of the weekend; first meshing my home wireless network by letting two routers form a single network, and after I was done, setting up MRTG (Multi-Router Traffic Grapher) for my Airport Extreme, which is the border gateway.
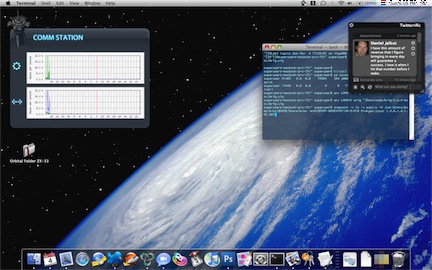
MRTG produces pretty graphs of networks statistics, and I integrated them into my Leopard desktop using a space station icon I am working on, a bit of Photoshopping and Geektool 2.1.2 (since the website is down, I’ll host it here for the interested). Geektool, in turn, is a preference pane that lets you show console output or images on your desktop, refreshed at a certain interval.
I’ll let the result speak for itself (click for larger version over at flickr);
If there’s any interest for it, I’m willing to write a nice how-to for setting all of this up easily. Drop a comment if you want to see such a post.
Looks really nice.. would love to see a how to.. :) Don’t have an Airport Extreme, would it still work?
Øyvind, it depends; it’s only possible if your router supports SNMP (check the internet, manuals, or web interface – these three are not mutually exclusive, even if there is no trace of it in your manual or web interface, do check on the ‘net).
A to-do would be awesome!
I’d definitely be interested.
I’d love to get the network stats graph — I have a linux box as a node on my network exclusively so I can play around with things like this. ;-)
(And yeah, I use an Airport Extreme, the new model.)
You can change the colours of the MRTG graphs, might make it blend in with the background.
Yeah. I’d like to have a “how-to” post.
And BTW – is GeekTool 2.1.2 support unicode?
NilColor, you might want to check up on your reading. The how-to has been posted for several days now.
I’d like to see a how-to if you want to do it…. Great stuff.
wow thanks for archiving GeekTool..
anyway, congrats for the new blog design ;)